Bull Hedging
  • Politics
  • Stocks
  • Business
  • Investing
  • Politics
  • Stocks
  • Business
  • Investing

Bull Hedging

Stocks

How to Trade Erratic Uptrends – An Example and Setup using IWM

by admin January 5, 2025
January 5, 2025
How to Trade Erratic Uptrends – An Example and Setup using IWM

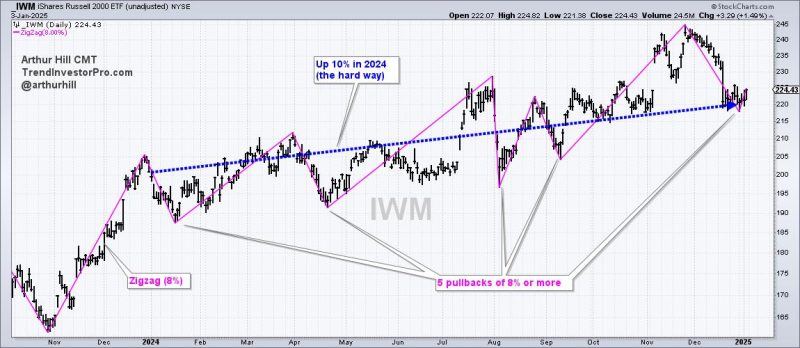
The Russell 2000 ETF managed a double-digit gain in 2024, but did it the hard way with several deep pullbacks. Pullbacks within uptrends are opportunities and we can find such opportunities using %B.

The chart below shows the Russell 2000 ETF (IWM) with the Zigzag(8) indicator. This indicator changes direction when there is a move greater than 8%, which means it ignores price moves that are less than 8%. I am showing this indicator to highlight five pullbacks of 8% or more in 2024. That’s a lot. In contrast, the S&P 500 SPDR (SPY) only experienced one 8+ percent pullback in early August.

Overall, IWM advanced 10% in 2024. That seems like a good year, but it was a “hard” 10% when we include the five 8+ percent pullbacks. This is simply the nature of small-cap stocks. They are less “trendy” than large-caps and have higher betas, making them more susceptible to wider fluctuations. Traders need to consider this when trading small-caps. As noted in Chart Trader this week, we see similar price action in the S&P 500 EW ETF (RSP) and S&P MidCap 400 SPDR (MDY).

Click here to take Chart Trader trial and get immediate access.

Buying upside breakouts is probably not the best strategy for trading IWM. Instead, traders should consider pullbacks and mean-reversion opportunities. We can identify such opportunities using Bollinger Bands (20,2) and %B (20,2). The middle line on the Bollinger Bands is the 20-day SMA and the bands are two standard deviations above and below. A close below the lower band means price fell two standard deviations and this creates an oversold condition.

Chartists can quantify oversold conditions using %B, which falls below 0 when the close is below the lower Bollinger Band. The blue lines on the chart above show %B dipping below 0 four times in 2024. Note that I would also only look for oversold conditions when price is above the 200-day SMA (long-term uptrend). When the bigger trend is up, a close below the lower Bollinger Band signals an oversold condition that can lead to a bounce.

December was a rough month for many stocks and ETFs. Even so, the weight of the evidence remains bullish for stocks and these pullbacks look like corrections within bigger uptrends. This week’s reports and videos focused on long-term breadth indicators, short-term oversold breadth, leading ETFs and a dozen ETFs with tradable pullbacks.

Click here to take a Chart Trader trial and get immediate access.

///////////////////////////////////////////////

previous post
MIKE POMPEO: New Orleans terror a reminder Team Biden took wrong ‘threats’ seriously and ignored real dangers
next post
Strongest Top 3 S&P 500 Stocks: Will They Lead the Pack in 2025?

Related Posts

How the S&P 500 Reaches 6500 By March...

January 23, 2025

Is the S&P 500 Flashing a Bearish Divergence?

June 14, 2025

SOFI Advances to SCTR’s Top 10: Is Now...

December 13, 2024

BSX Stock Slump? Discover This Winning Option Strategy

April 3, 2025

Two Down and Two to Go – Capitulation...

May 4, 2025

Real-Time Options Strategies on Your ChartLists? Yes, Please!

April 26, 2025

Learning Painful Lessons is the Start to Building...

May 26, 2025

Three Sectors Stand Out and One Sports a...

June 14, 2025

This is the Group to Watch for the...

April 19, 2025

BEWARE! META, TSLA, AMZN, MSFT & AAPL Report...

January 27, 2025

Recent Posts

  • RGTI Stock Surged 30% — Is This the Start of a Quantum Comeback?
  • Three Bearish Candle Patterns Every Investor Should Know
  • These HOT Industry Groups are Fueling This Secular Bull Market
  • ‘Irrelevant’: Senators push back against Vought’s call for more partisan spending process
  • Biden-era policy indirectly paying for unaccompanied minors’ abortions rescinded by Trump DOJ

Recent Comments

No comments to show.

About Us

About Us

Design Magazine

Welcome to Design Magazine. Follow us for daily & updated design tips, guide and knowledge.

Stay Connect

Facebook Twitter Instagram Pinterest Youtube Email

Recent Posts

  • RGTI Stock Surged 30% — Is This the Start of a Quantum Comeback?

    July 18, 2025
  • Three Bearish Candle Patterns Every Investor Should Know

    July 18, 2025
  • These HOT Industry Groups are Fueling This Secular Bull Market

    July 18, 2025
  • ‘Irrelevant’: Senators push back against Vought’s call for more partisan spending process

    July 18, 2025
  • Biden-era policy indirectly paying for unaccompanied minors’ abortions rescinded by Trump DOJ

    July 18, 2025
  • Unearthed chat sheds light on cozy ties between judges, climate activists, raising ethical concerns

    July 18, 2025

Editors’ Picks

  • 1

    Small Caps are Set to Skyrocket in 2025—Here’s What You Need to Know

    December 12, 2024
  • 2

    Trump leaves China guessing what his next move is with unusual inauguration invitation

    December 15, 2024
  • 3

    Ad revenue should stabilize for media companies in 2025 — if they have sports

    December 31, 2024
  • 4

    Uranium Price Forecast: Top Trends That Will Affect Uranium in 2025

    December 19, 2024
  • 5

    Lead Price Forecast: Top Trends for Lead in 2025

    January 11, 2025
  • 6

    Zinc Stocks: 4 Biggest Canadian Companies in 2025

    January 15, 2025
  • 7

    Trudeau declares himself ‘proud feminist’ after lamenting Harris loss to Trump as setback for women

    December 13, 2024
Promotion Image

banner

Categories

  • Business (455)
  • Investing (1,586)
  • Politics (1,957)
  • Stocks (662)
  • About us
  • Contacts
  • Privacy Policy
  • Terms and Conditions
  • Email Whitelisting

Disclaimer: bullhedging.com, its managers, its employees, and assigns (collectively “The Company”) do not make any guarantee or warranty about what is advertised above. Information provided by this website is for research purposes only and should not be considered as personalized financial advice. The Company is not affiliated with, nor does it receive compensation from, any specific security. The Company is not registered or licensed by any governing body in any jurisdiction to give investing advice or provide investment recommendation. Any investments recommended here should be taken into consideration only after consulting with your investment advisor and after reviewing the prospectus or financial statements of the company.


Copyright © 2025 bullhedging.com | All Rights Reserved