Sector Rotation Shakeup: Industrials Take the Lead
Another week of significant movement in the sector landscape has reshaped the playing field. The Relative Rotation Graph (RRG) paints a picture of shifting dynamics, with some surprising developments in sector leadership. Let’s dive into the details and see what’s happening under the hood.
- (6) Industrials – (XLI)*
- (4) Financials – (XLF)*
- (1) Utilities – (XLU)*
- (2) Communication Services – (XLC)*
- (3) Consumer Staples – (XLP)*
- (8) Technology – (XLK)*
- (5) Real-Estate – (XLRE)*
- (9) Materials – (XLB)*
- (11) Energy – (XLE)*
- (10) Consumer Discretionary – (XLY)
- (7) Healthcare – (XLV)*
Weekly RRG
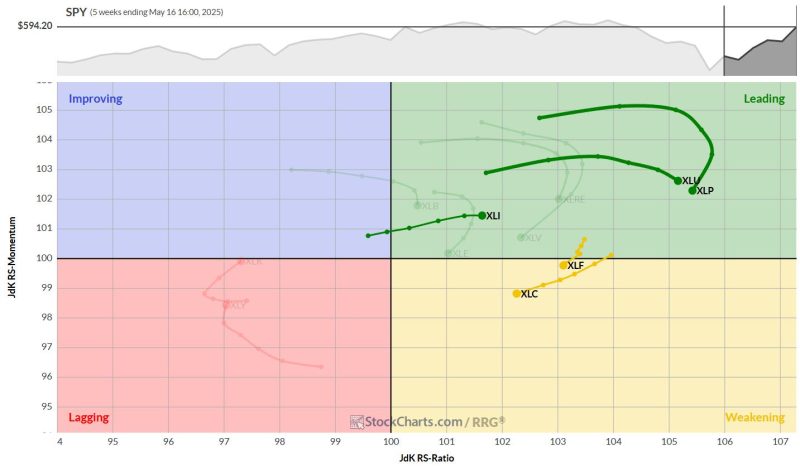
On the weekly RRG, Utilities and Consumer Staples maintain their high positions on the RS-Ratio scale. However, there are signs of waning momentum. Staples has rolled over within the leading quadrant and is now showing a negative heading. Utilities, while still strong, are losing some of their relative momentum.
Financials and Communication Services are hanging on in the weakening quadrant, but their tails are relatively short — indicating potential for a quick turnaround.
The show’s star, Industrials, has made a beeline for the leading quadrant, climbing on the RS-Ratio scale while maintaining a positive RRG heading.
Daily RRG
Switching to the daily RRG, we get a more granular view. Utilities, Staples, and Financials are found in the lagging quadrant, but Staples and Utilities are showing signs of life, turning back up towards the improving quadrant.
Financials, meanwhile, are hugging the benchmark.
The daily chart confirms Industrials’ strength, mirroring its weekly performance.
Communication Services, however, is showing some worrying signs — it’s dropped into the weakening quadrant on the daily RRG, confirming its vulnerable position on the weekly chart.
Industrials
XLI flexes its muscles, pushing against overhead resistance around the $144 mark.
A break above this level could trigger a further acceleration in price.
The relative strength line has already broken out of its consolidation pattern, propelling both RRG lines above 100 and driving the XLI tail deeper into the leading quadrant.
Financials
The financial sector continues its upward trajectory, trading above its previous high and closing in on the all-time high of around $53.
Like Industrials, a break above this resistance could spark a new leg up.
The RS line is moving sideways within its rising channel, causing the RRG lines to flatten—something to watch.
Utilities
XLU has finally broken through its overhead resistance, approaching its all-time high around $83.
After months of pushing against the $80 level, this breakout is a clear sign of strength.
The RS line is still grappling with its own resistance, but the RS-Ratio line continues its gradual ascent.
Communication Services
While XLC is moving higher on the price chart, its relative strength is lagging.
The sideways movement in the RS line is causing both RRG lines to move lower, with the RS-Momentum line already below 100.
This sector is rapidly approaching the lagging quadrant on the daily RRG—definitely one to watch for potential risks.
Consumer Staples
XLP is approaching the upper boundary of its trading range ($83-$85), where it is running into resistance. The inability to push higher while the market is moving up is causing relative strength to falter.
The recent strength has pushed both RRG lines well above 100, but the current loss of relative strength is now causing the RRG-Lines to roll over.
The tail is still comfortably within the leading quadrant, but this loss of momentum could signal a potential setback.
Portfolio Performance
The model portfolio’s defensive positioning has led to some underperformance relative to SPY, with the gap now just under 6%.
However, the model is sticking to its guns, maintaining a defensive stance with Staples and Utilities firmly in the top five.
It’s worth noting that Healthcare has now definitively dropped out of the top ranks. Nevertheless, with Staples and Utilities holding firm, and Technology and Consumer Discretionary still in the bottom half, the overall positioning remains cautious.
These are the periods when patience is key. We need to let the model do its work and wait for new, meaningful relative trends to emerge. It’s not always comfortable to endure underperformance, but it’s often necessary to capture longer-term outperformance.
#StayAlert, –Julius

