Bull Hedging
  • Politics
  • Stocks
  • Business
  • Investing
  • Politics
  • Stocks
  • Business
  • Investing

Bull Hedging

Stocks

Market Pullbacks Provide Opportunities to Build your WatchList – Here’s How

by admin January 12, 2025
January 12, 2025
Market Pullbacks Provide Opportunities to Build your WatchList – Here’s How

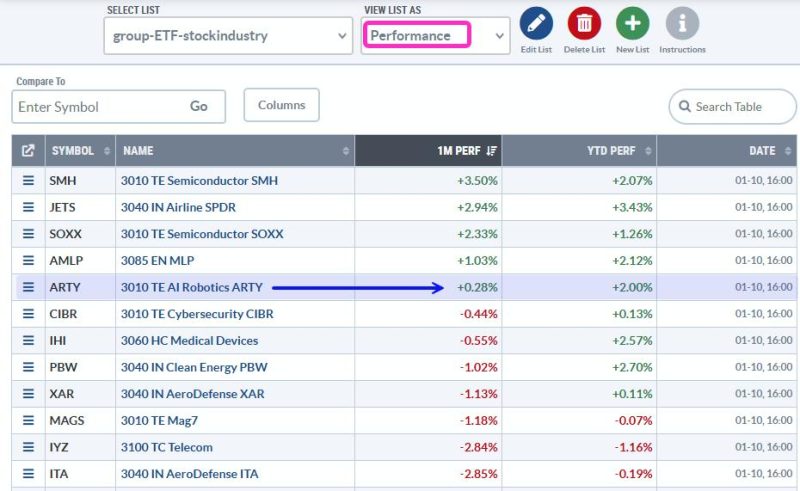
The stock market is in pullback mode with the S&P 500 EW ETF down 5.15% over the past month and down 1% year-to-date. This makes it a good time to monitor relative performance and create a relative strength watch list. Stocks and ETFs holding up best during pullbacks often lead when the market regains its footing. Today’s report will show a starter list and analyze the chart for an AI Robotics ETF.

The table below shows 1-month and year-to-date performance for a selection of industry group ETFs. With the S&P 500 EW ETF down on both timeframes, ETFs with gains are holding up well and ETFs with smaller losses show relative strength (less weakness). Five ETFs are up on both timeframes and holding up well in the face of broad market weakness.

Note that this list is simply the first cut. I would make a further cut by insuring that the ETF is in a long-term uptrend. For example, the Clean Energy ETF (PBW) is below its 200-day SMA and would not make the cut. The Medical Devices ETF (IHI) and Robotics AI ETF (ARTY) are in long-term uptrends, and make the cut. Let’s look at ARTY. A recent Chart Trader report/video highlighted the recent breakout in IHI.

The chart below shows ARTY hitting a new high in early December and price above the rising 200-day SMA. ARTY is in a long-term uptrend. There was a big breakout in mid October, an oversold reading in late October and then a 17% run to new highs. ARTY then formed a pennant and broke out with a surge earlier this week, only to fall back the last three days. Overall, I think the pennant breakout is still bullish and this is a throwback to the breakout zone. A break below the pennant lows would negate this pattern and argue for a deeper correction.

Chart Link

The middle window shows the price-relative (ARTY/RSP Ratio) breaking above its 200-day SMA in late November. ARTY shows relative strength and the price-relative hit a new high in early January. The lower window shows %B, which I use to identify oversold conditions within an uptrend. A dip below 0 means the close is below the lower Bollinger Band. This means there was a pullback within the uptrend, which is an opportunity.

I will be following ARTY and other leading ETFs closely in the Chart Trader reports and videos. Our reports warned of the breakout in the 10-yr Treasury Yield in before Christmas (HERE) and we also showed how to distinguish between a robust bounce and a dead cat bounce (HERE).

Click here to take Chart Trader trial and get immediate access.

//////////////////////////////////////////////////

previous post
Here’s Why The Bottom Is Dropping Out of the Dow Jones
next post
What Higher Rates Could Mean for the S&P 500

Related Posts

DP Trading Room: Black Swan Monday

January 28, 2025

Investment Portfolio Feeling Stagnant? Transform Your Path Today

May 10, 2025

Unlocking the Secrets to Profitable Semiconductor Investments

February 22, 2025

Why the Market is Ready to Rally!

March 16, 2025

S&P 500 Rises from Bearish to Neutral, But...

April 27, 2025

What Would It Take For Small Caps to...

January 17, 2025

Here’s Why The Bottom Is Dropping Out of...

January 12, 2025

S&P 500 Breakdown Alert! Downside Targets Explained

January 12, 2025

Long Bonds Continue to Break Down

January 18, 2025

These High-Yield Stocks are Still Winning Despite Market...

March 30, 2025

Recent Posts

  • Breakouts, Momentum & Moving Averages: 10 Must-See Stock Charts Right Now
  • Hedge Market Volatility with These Dividend Aristocrats & Sector Leaders
  • S&P 500 Bullish Patterns: Are Higher Highs Ahead?
  • Strategic Chaos or Tactical Goldmine? What QQQ’s Chart is Whispering Right Now
  • Why ADX Can Mislead You — And How to Avoid It

Recent Comments

No comments to show.

About Us

About Us

Design Magazine

Welcome to Design Magazine. Follow us for daily & updated design tips, guide and knowledge.

Stay Connect

Facebook Twitter Instagram Pinterest Youtube Email

Recent Posts

  • Breakouts, Momentum & Moving Averages: 10 Must-See Stock Charts Right Now

    June 5, 2025
  • Hedge Market Volatility with These Dividend Aristocrats & Sector Leaders

    June 5, 2025
  • S&P 500 Bullish Patterns: Are Higher Highs Ahead?

    June 5, 2025
  • Strategic Chaos or Tactical Goldmine? What QQQ’s Chart is Whispering Right Now

    June 5, 2025
  • Why ADX Can Mislead You — And How to Avoid It

    June 5, 2025
  • S&P 500 on the Verge of 6,000: What’s at Stake?

    June 5, 2025

Editors’ Picks

  • 1

    Small Caps are Set to Skyrocket in 2025—Here’s What You Need to Know

    December 12, 2024
  • 2

    Trump leaves China guessing what his next move is with unusual inauguration invitation

    December 15, 2024
  • 3

    Uranium Price Forecast: Top Trends That Will Affect Uranium in 2025

    December 19, 2024
  • 4

    Ad revenue should stabilize for media companies in 2025 — if they have sports

    December 31, 2024
  • 5

    Zinc Stocks: 4 Biggest Canadian Companies in 2025

    January 15, 2025
  • 6

    Trudeau declares himself ‘proud feminist’ after lamenting Harris loss to Trump as setback for women

    December 13, 2024
  • 7

    Lead Price Forecast: Top Trends for Lead in 2025

    January 11, 2025
Promotion Image

banner

Categories

  • Business (388)
  • Investing (1,273)
  • Politics (1,577)
  • Stocks (525)
  • About us
  • Contacts
  • Privacy Policy
  • Terms and Conditions
  • Email Whitelisting

Disclaimer: bullhedging.com, its managers, its employees, and assigns (collectively “The Company”) do not make any guarantee or warranty about what is advertised above. Information provided by this website is for research purposes only and should not be considered as personalized financial advice. The Company is not affiliated with, nor does it receive compensation from, any specific security. The Company is not registered or licensed by any governing body in any jurisdiction to give investing advice or provide investment recommendation. Any investments recommended here should be taken into consideration only after consulting with your investment advisor and after reviewing the prospectus or financial statements of the company.


Copyright © 2025 bullhedging.com | All Rights Reserved