Bull Hedging
  • Politics
  • Stocks
  • Business
  • Investing
  • Politics
  • Stocks
  • Business
  • Investing

Bull Hedging

Stocks

These 3 Charts Are Among The Most Critical To Start 2025

by admin January 4, 2025
January 4, 2025
These 3 Charts Are Among The Most Critical To Start 2025

Obviously, there will be many ups and downs in 2025 and no one chart or indicator can be relied upon 100% to help guide us throughout the year. But some key and very influential areas of the market do meet crossroads from time to time and it seems like one very important industry group is “on the clock” and should really garner our attention right now.

Regional Banks

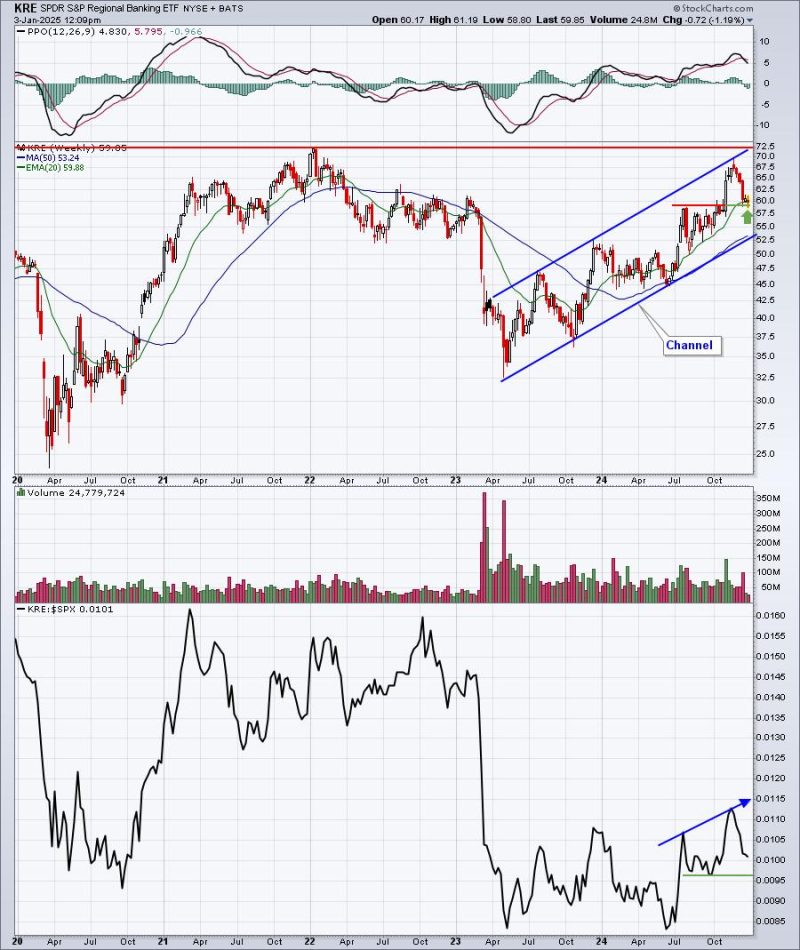
While I don’t look for market-beating returns out of regional banks (KRE) to feel good about a secular bull market, I really do want to see them participate in market advances. If we look back at the last 5 years, the KRE has been a serious laggard, but its relative strength vs. the benchmark S&P 500 has shown some life since July 2024, at the time that the June Core PPI was released. Wall Street immediately moved into regional banks in droves as the likely fed funds rate cuts ahead would directly increase profits significantly for all banks, but especially small to mid size banks. But will this newfound strength continue? Well, let’s look at the key levels using 3 different time frames.

Weekly

The big picture has clearly been improving, which bodes well for 2025. However, we don’t want to begin to see cracks in the house foundation turn into a collapsing house. I like the recovery this week after testing key price support around 59. But a drop below 59 could lead to a lower channel line support test, closer to 53. That would be another 10% drop, which wouldn’t be good. Let’s move to the next chart:

Daily

This is an interesting chart. The channel lines don’t connect perfectly, especially the lower uptrend line, but it’s close. Furthermore, the KRE printed a double bottom at 59, almost squarely on gap support that was created by the 2024 Presidential Election results. In order to feel more bullish about this chart, I’d like to see the KRE move higher and clear both the declining 20-day EMA and recent price resistance at about 61.50. For a final look at the KRE, check this out.

Hourly

This is the crack in the foundation. While absolute price support has held and we now show a potential double bottom, relative action tells us a different story as the KRE has moved to another relative low on this hourly chart. Which way will the KRE bounce? If it can clear its current consolidation range by closing above 61.50, the odds of a bullish reversal improve considerably and will likely spill over into the daily and weekly charts above. On the other hand, should the KRE turn lower again and fail to hold 58.80 price support, the hourly breakdown could lead to daily, and then weekly, breakdowns as well.

Market Vision 2025

Regional banks is just one key industry group to watch early in 2025. I see a few others that I’ll be discussing tomorrow at our MarketVision 2025 event, “The Year of Diverging Returns”, which begins at 10:00am ET. To learn more about the event and to register, please CLICK HERE.

Happy trading!

Tom

previous post
Zelenskyy says Trump could be ‘decisive’ in bringing an end to the war
next post
SPY Weekly Chart Breaking Down

Related Posts

Three RRGs to Keep You on Track

December 20, 2024

Demystifying Tariff Impact: Essential Insights for Every Investor

April 5, 2025

S&P 500 Final 2024 Q4 Earnings: Still Overvalued

April 13, 2025

Walmart, Costco, and Sprouts: The Ultimate Trade War...

February 5, 2025

We’re Topping With BEARISH Action Ahead!

February 2, 2025

Top Techniques for Finding Strength in Sectors

December 12, 2024

Two Down and Two to Go – Capitulation...

May 4, 2025

Three Reasons to Consider Gold

March 15, 2025

S&P 500 Earnings 2024 Q3: Still Overvalued

January 11, 2025

Long Bonds Continue to Break Down

January 18, 2025

Recent Posts

  • Emerging Stocks to Watch – Breakouts, Momentum & Upgrades!
  • S&P 500, Bitcoin & XLK: What the Charts Are Saying Now
  • MACD + ADX: Spot the Pullbacks Worth Trading
  • S&P 500 Slide Explained: What Past Price Action Reveals About Market Dips
  • Republicans look to stop China’s ‘backdoor’ tariff dodging scheme

Recent Comments

No comments to show.

About Us

About Us

Design Magazine

Welcome to Design Magazine. Follow us for daily & updated design tips, guide and knowledge.

Stay Connect

Facebook Twitter Instagram Pinterest Youtube Email

Recent Posts

  • Emerging Stocks to Watch – Breakouts, Momentum & Upgrades!

    May 23, 2025
  • S&P 500, Bitcoin & XLK: What the Charts Are Saying Now

    May 23, 2025
  • MACD + ADX: Spot the Pullbacks Worth Trading

    May 23, 2025
  • S&P 500 Slide Explained: What Past Price Action Reveals About Market Dips

    May 23, 2025
  • Republicans look to stop China’s ‘backdoor’ tariff dodging scheme

    May 23, 2025
  • Trump has not directed admin to declassify Biden docs on health ‘cover-up’

    May 23, 2025

Editors’ Picks

  • 1

    Small Caps are Set to Skyrocket in 2025—Here’s What You Need to Know

    December 12, 2024
  • 2

    Trump leaves China guessing what his next move is with unusual inauguration invitation

    December 15, 2024
  • 3

    Uranium Price Forecast: Top Trends That Will Affect Uranium in 2025

    December 19, 2024
  • 4

    Ad revenue should stabilize for media companies in 2025 — if they have sports

    December 31, 2024
  • 5

    Trudeau declares himself ‘proud feminist’ after lamenting Harris loss to Trump as setback for women

    December 13, 2024
  • 6

    Zinc Stocks: 4 Biggest Canadian Companies in 2025

    January 15, 2025
  • 7

    Lead Price Forecast: Top Trends for Lead in 2025

    January 11, 2025
Promotion Image

banner

Categories

  • Business (365)
  • Investing (1,182)
  • Politics (1,474)
  • Stocks (478)
  • About us
  • Contacts
  • Privacy Policy
  • Terms and Conditions
  • Email Whitelisting

Disclaimer: bullhedging.com, its managers, its employees, and assigns (collectively “The Company”) do not make any guarantee or warranty about what is advertised above. Information provided by this website is for research purposes only and should not be considered as personalized financial advice. The Company is not affiliated with, nor does it receive compensation from, any specific security. The Company is not registered or licensed by any governing body in any jurisdiction to give investing advice or provide investment recommendation. Any investments recommended here should be taken into consideration only after consulting with your investment advisor and after reviewing the prospectus or financial statements of the company.


Copyright © 2025 bullhedging.com | All Rights Reserved